Project
Mapping Urban Visual Pollution at Global Scale Using Street-View Imagery and Deep Learning
Submission for the 2026 British Machine Vision Conference.
View the full paper → Co-authors: Karthik Mohan and Sohan Seth
Submission outcome: Rejected
Overview
This project is a continuation of my dissertation, extending the original work with additional experiments, broader evaluation, revised scoring methods, and more detailed geographic analysis.
Rather than repeating the full dissertation methodology, this page focuses on the new experiments and findings introduced in the paper.
Per-class analysis
The detection model was evaluated across nine classes of visual pollution.
| Pollutant | Severity | Detections | Cities | Countries | Avg. Confidence | Recall |
|---|---|---|---|---|---|---|
| Billboard | 0.9 | 446,645 | 3,707 | 176 | 0.787 | 0.776 |
| Graffiti | 0.4 | 20,152 | 1,906 | 156 | 0.711 | 0.625 |
| Utility Pole | 0.3 | 1,136,380 | 3,770 | 176 | 0.776 | 0.780 |
| Bin | 0.2 | 13,587 | 1,791 | 145 | 0.701 | 0.739 |
| Pothole | 0.1 | 2,824 | 1,180 | 146 | 0.634 | 0.591 |
| Barrier | 0.1 | 42,748 | 2,486 | 163 | 0.753 | 0.780 |
| Mobile Advertisement | 0.1 | 14,122 | 2,458 | 158 | 0.723 | 0.783 |
| Shop Sign | 0.1 | 78,880 | 3,074 | 171 | 0.707 | 0.688 |
| Road Sign | 0.0 | 592,092 | 3,581 | 176 | 0.796 | 0.841 |
The large variation in the number of detections reflects the class imbalance present in the training data.
Classes such as utility poles and billboards are common in street-view imagery and therefore had substantially more training examples. By contrast, classes such as potholes and mobile advertisements were much harder to source, resulting in fewer examples and generally weaker performance.
Despite this imbalance, the system identified examples of every class across a large number of cities and countries. This suggests that the model can also be useful as a large-scale dataset creation tool, where detections can be used to identify and collect examples for future training datasets.
Severity weighting
Each pollutant was assigned a severity score based on previous work. These weights were incorporated into the Visual Pollution Index (VPI) so that more visually disruptive classes contributed more strongly to the final score.
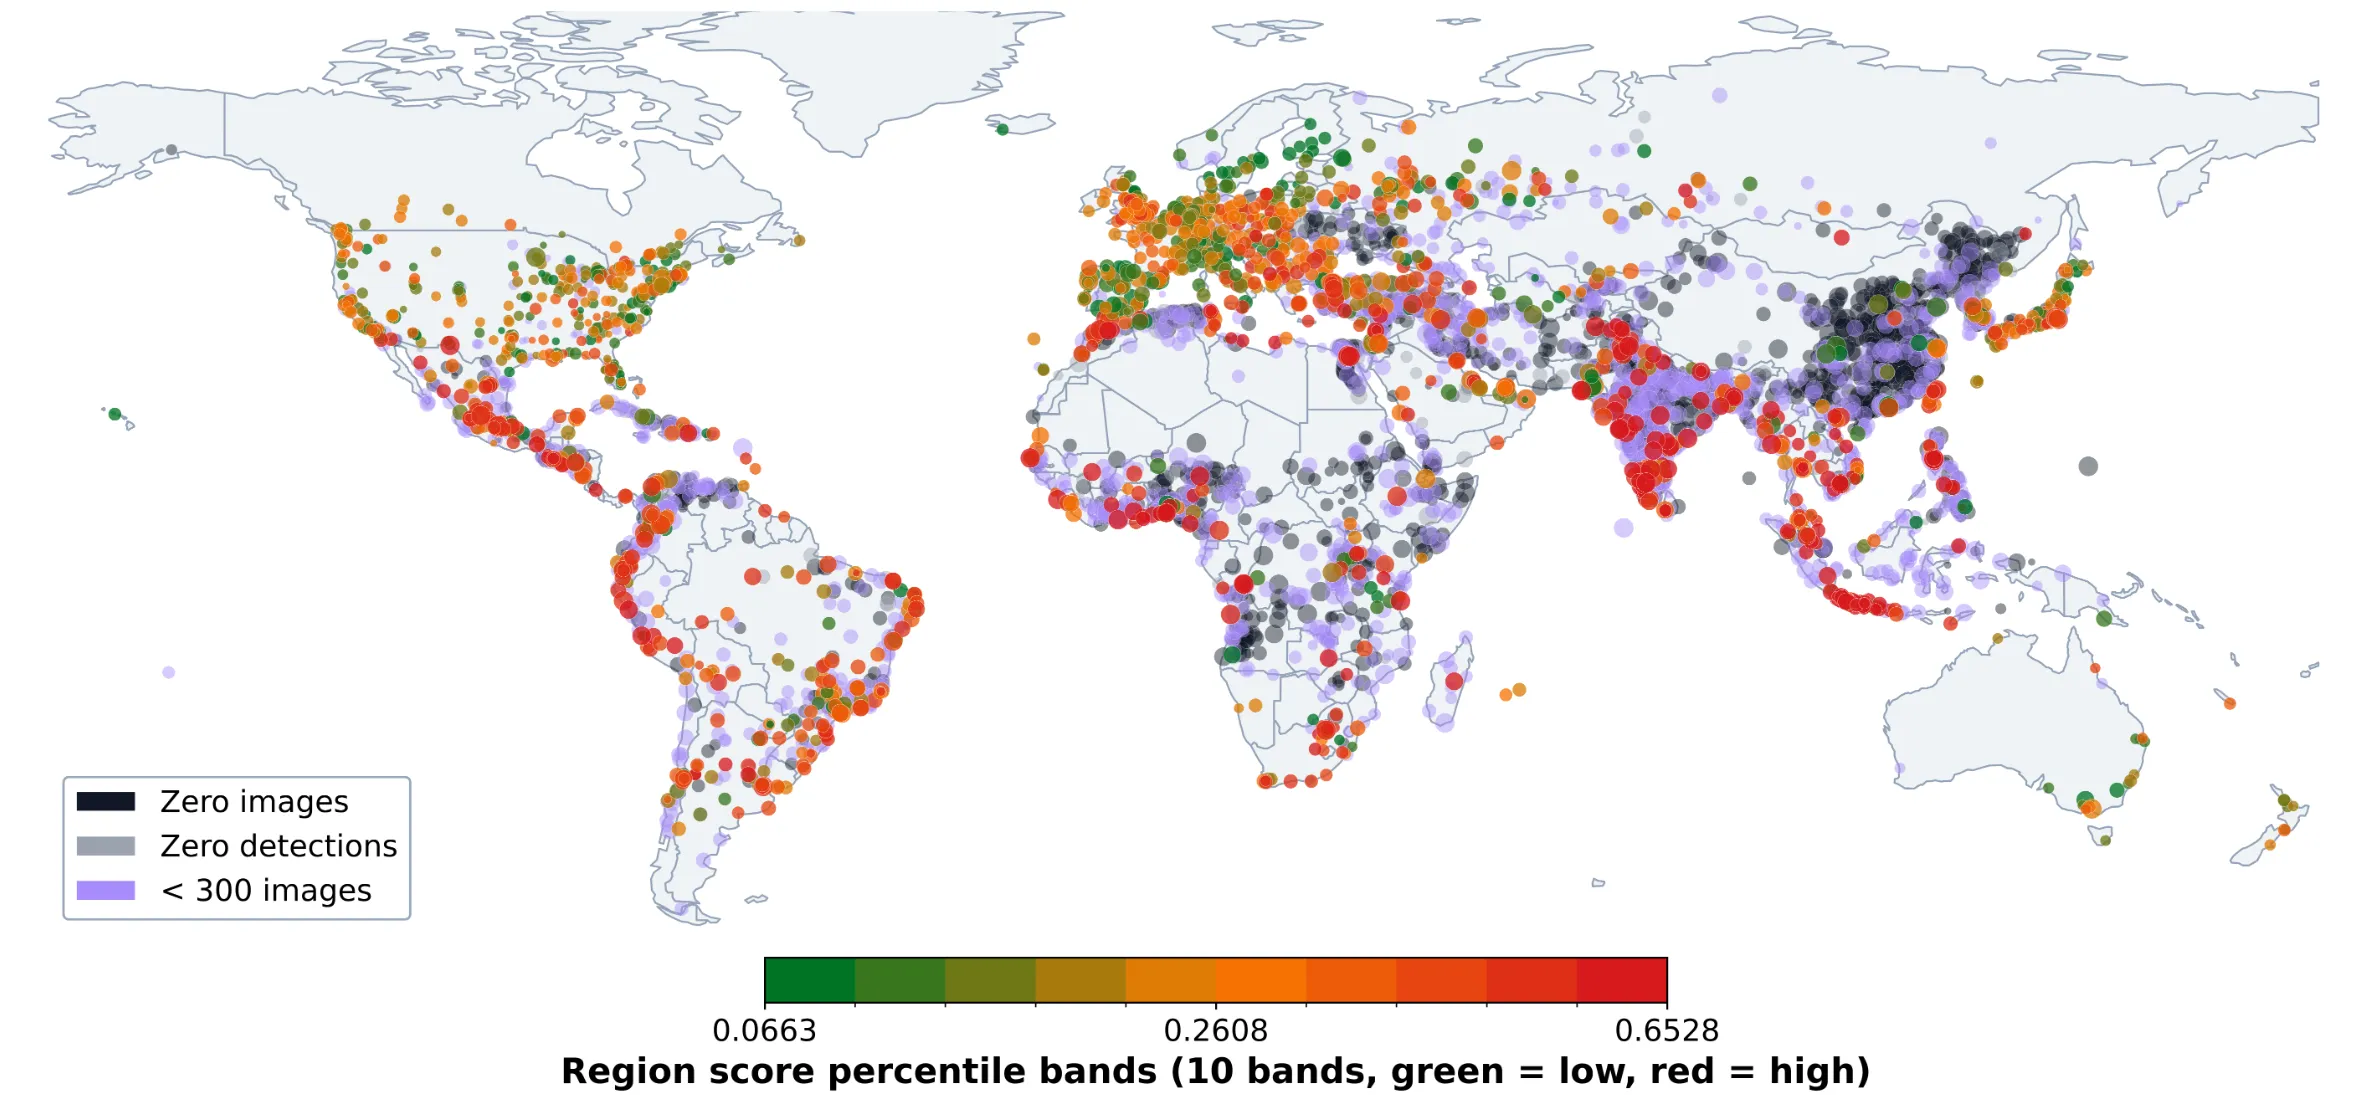
To reduce the effect of sparse data, only cities with more than 300 collected images were included in the city-level VPI analysis. This prevented cities represented by only a small number of images from receiving disproportionately high or low scores.
Refined scoring metric
The original dissertation ranked individual cities directly by their VPI scores. For the paper, this analysis was revised to reduce the emphasis placed on individual cities and instead examine country-level patterns.
Countries were ranked according to the number and proportion of their cities appearing in the top and bottom 10% of global VPI scores.
| Most Cities in Top 10% | Cities / Total | % | Most Cities in Bottom 10% | Cities / Total | % |
|---|---|---|---|---|---|
| Indonesia | 38 / 56 | 67.9 | United States | 64 / 323 | 19.8 |
| India | 32 / 54 | 59.3 | Spain | 17 / 50 | 34.0 |
| Philippines | 16 / 35 | 45.7 | Japan | 13 / 157 | 8.3 |
| South Africa | 12 / 33 | 36.4 | Russia | 13 / 82 | 15.9 |
| Pakistan | 8 / 29 | 27.6 | Finland | 8 / 8 | 100.0 |
| Vietnam | 6 / 23 | 26.1 | Pakistan | 6 / 29 | 20.7 |
| Nigeria | 6 / 15 | 40.0 | Sweden | 6 / 11 | 54.5 |
| Thailand | 5 / 10 | 50.0 | Turkey | 4 / 51 | 7.8 |
| Peru | 4 / 13 | 30.8 | Italy | 4 / 36 | 11.1 |
| Ghana | 4 / 7 | 57.1 | Netherlands | 4 / 26 | 15.4 |
This approach provides a broader view of geographic trends while avoiding overly strong conclusions based on the score of a single city.
Additional experiments
Advertising regulation in Poland
The Poland experiment was expanded to include six cities with different levels of advertising regulation.
The analysis compared billboard detection rates before and after regulations were introduced. Warsaw was included as an unregulated comparison city.
| City | Regulation | Period | Images | Billboards | Detection Rate | Change |
|---|---|---|---|---|---|---|
| Warsaw | None | 2014–2019 | 18,327 | 5,358 | 0.292 | — |
| Warsaw | None | 2020–2026 | 22,901 | 5,265 | 0.230 | −21.36% |
| Kraków | High | 2014–2019 | 8,565 | 3,361 | 0.392 | — |
| Kraków | High | 2020–2026 | 14,982 | 2,669 | 0.178 | −54.60% |
| Gdańsk | High | 2014–2017 | 3,527 | 1,171 | 0.332 | — |
| Gdańsk | High | 2018–2026 | 4,308 | 648 | 0.150 | −54.69% |
| Wrocław | Moderate | 2014–2019 | 7,155 | 2,189 | 0.306 | — |
| Wrocław | Moderate | 2020–2026 | 6,646 | 1,192 | 0.179 | −41.38% |
| Łódź | High | 2014–2015 | 665 | 353 | 0.531 | — |
| Łódź | High | 2016–2026 | 6,323 | 1,559 | 0.247 | −53.55% |
| Poznań | High | 2014–2022 | 6,986 | 2,328 | 0.333 | — |
| Poznań | High | 2023–2026 | 6,347 | 1,225 | 0.193 | −42.08% |
Billboard detection rates fell in all six cities.
The five regulated cities showed reductions of approximately 41% to 55%, while Warsaw, which had no equivalent regulation, showed a smaller reduction of 21.36%.
This does not establish a direct causal relationship between regulation and billboard prevalence. However, the larger reductions observed in the regulated cities are consistent with the possibility that advertising restrictions contributed to the decline.
More importantly, the experiment demonstrates that the proposed method can be used to measure long-term changes in the urban environment using historical street-view imagery.
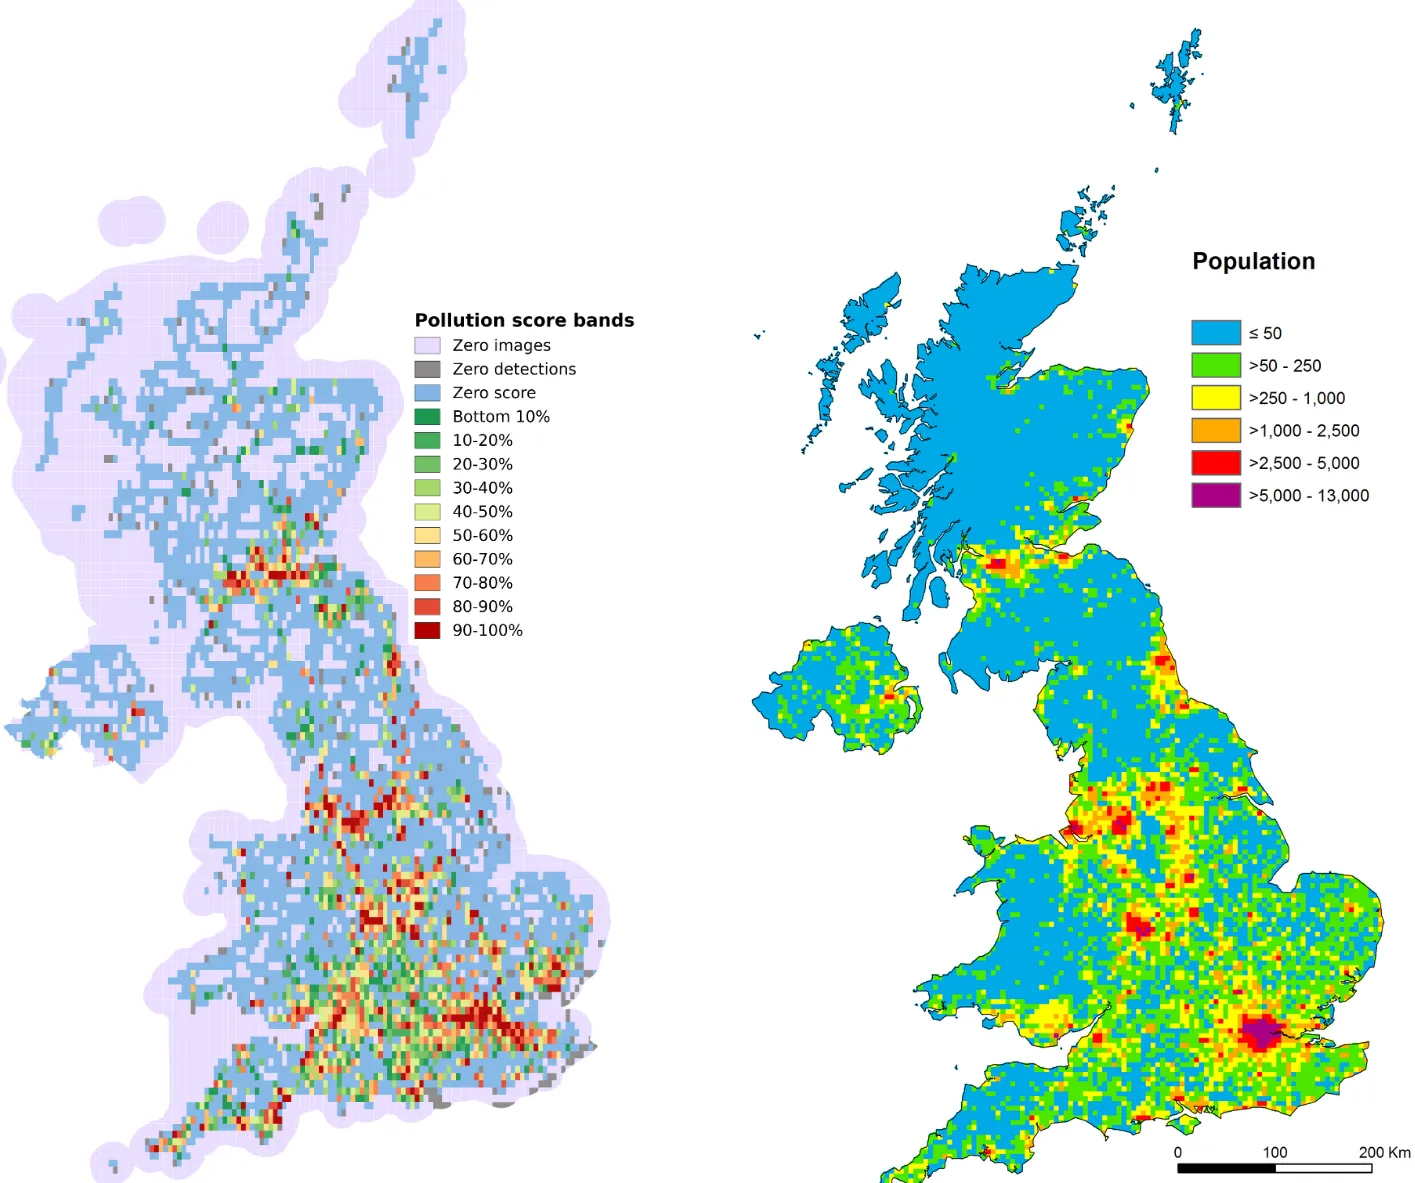
United Kingdom high-resolution scan
The global analysis was designed to compare cities at a large scale. A separate experiment was therefore conducted to investigate whether the same system could provide higher-resolution analysis within a single country.
The United Kingdom was divided into 10,000 geographic subregions. Within each subregion, up to 10,000 locations were sampled and queried for available street-view imagery.
This produced a much denser spatial scan than the city-level global analysis and demonstrated how the framework could be adapted for more detailed regional monitoring.