Project
Vision for Pollution - Deep Learning to detect visual pollution
4th year undergraduate dissertation.
View the full paper → Supervisors: Karthik Mohan and Sohan Seth
Final Grade: 82%
Conference submission: This project was later adapted for a submission to the British Machine Vision Conference (BMVC). View →
Overview
Visual pollution is caused by man-made elements such as advertisements, infrastructure, and urban clutter that negatively affect perceived environmental quality and human wellbeing.
This project presents a scalable computer vision framework for detecting and quantifying visual pollution using deep learning and large-scale street-view imagery.
Methods
The project followed a large-scale data collection and analysis pipeline:
-
City selection
Used a public global cities dataset to identify cities with populations greater than 100,000. -
Street-view data collection
Sourced geolocated street-view imagery from Mapillary within each city’s boundary and stored the associated metadata. -
Object detection
Trained a YOLO26 model to detect nine classes of visual pollution.Billboards, Utility Poles, Graffiti, Mobile Advertisement, Shop Signs, Road Signs, Barriers, Potholes
-
Large-scale inference
Ran the trained model on more than 2,000,000 images to measure visual pollution across cities worldwide. -
Visual Pollution Index
Developed a Visual Pollution Index (VPI) to quantify and compare pollution levels between regions.
Results
Visual Pollution Index
The VPI was used to rank cities according to their measured levels of visual pollution.
| Highest Pollution City | Country | VPI | Lowest Pollution City | Country | VPI |
|---|---|---|---|---|---|
| Kolkata | India | 0.653 | Shenzhen | China | 0.071 |
| Pune | India | 0.568 | Lahti | Finland | 0.078 |
| Barman Kalan | India | 0.567 | Mission Viejo | United States | 0.082 |
| Dhaka | Bangladesh | 0.563 | Siracusa | Italy | 0.086 |
| Kumasi | Ghana | 0.562 | Columbia | United States | 0.089 |
| Caloocan City | Philippines | 0.560 | Roseville | United States | 0.099 |
| Malang | Indonesia | 0.538 | Messina | Italy | 0.110 |
| Chennai | India | 0.532 | Pomona | United States | 0.112 |
| Purwokerto | Indonesia | 0.531 | Stockholm | Sweden | 0.112 |
| Vishakhapatnam | India | 0.523 | Serpukhov | Russia | 0.113 |
Global VPI Map
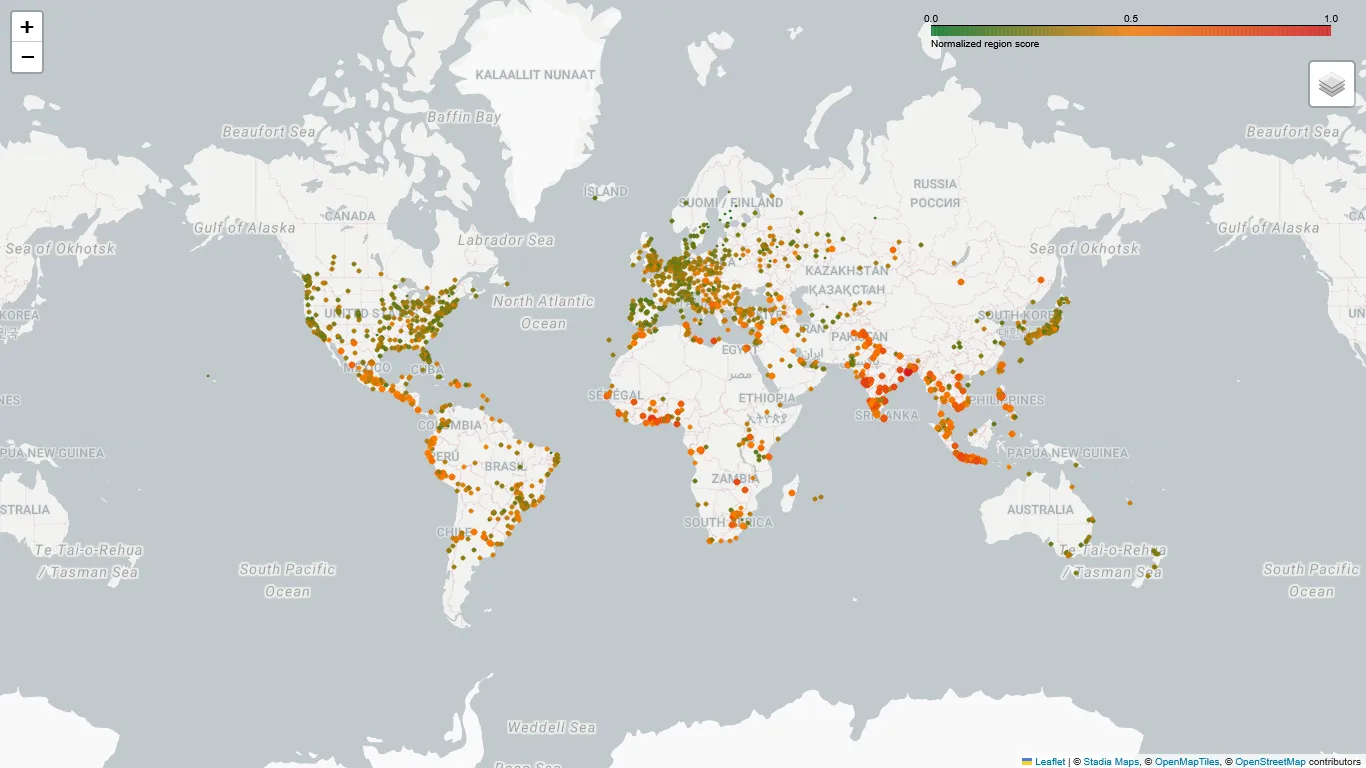
The resulting scores were used to construct a global map showing the geographic distribution of visual pollution across the evaluated cities. It shows that while western countries have more cities with lower VPI scores, there are also more cities with sufficient data to calculate a score.
Poland Advertising Regulation Experiment
In 2015, Poland introduced legislation giving municipalities greater powers to regulate the aesthetics of public spaces, including advertising and signage.
To investigate whether the proposed framework could detect changes over time, billboard prevalence was compared before and after local regulations were introduced in three Polish cities.
| City | Period | Images | Billboards | Density | Change |
|---|---|---|---|---|---|
| Kraków | 2005–2019 | 3,600 | 876 | 0.243 | — |
| 2020–2026 | 7,941 | 967 | 0.122 | −49.9% | |
| Gdańsk | 2005–2017 | 1,901 | 550 | 0.289 | — |
| 2018–2026 | 2,059 | 353 | 0.171 | −40.8% | |
| Wrocław | 2005–2019 | 4,005 | 1,035 | 0.258 | — |
| 2020–2026 | 4,295 | 680 | 0.158 | −38.7% |
Billboard density declined substantially across all three cities, with reductions ranging from 38.7% to 49.9%.
These results do not establish that the regulations directly caused the decline. However, they demonstrate that the proposed framework can detect and quantify long-term changes in visual pollution using historical street-view imagery.
Limitations
Data Availability
The primary limitation was the availability of street-view imagery. Since the project relied on crowd-sourced data, coverage varied considerably between countries and cities.
Wealthier and more frequently mapped regions generally contained substantially more imagery, producing more reliable VPI estimates. Cities with limited coverage could not always be evaluated with the same level of confidence.
Training Data Imbalance
The second major limitation was variation in the amount of training data available for different pollutant classes.
Common visual pollutants, such as billboards, appeared frequently in available imagery and therefore had more training examples. Less common or harder-to-identify pollutants, such as potholes, had fewer examples and consequently produced less reliable detections.